

The west coast of Florida experienced an early forecast for the next decade: suffering, the loss of homes, personal effects, and life-threatening infrastructure. Smart people chose to evacuate. Some who had insurance may rebuild, and others will relocate to higher ground, relieved to have made the correct choice.
At first sea level will increase drastically during storms, and annual tidal surges when the moon and sun are aligned, causing brief inundations. Climatologists and others have forecasted that the sea level will rise as a result of warming trends and the melting of polar ice caps. The polar ice caps in the north and the huge mass of
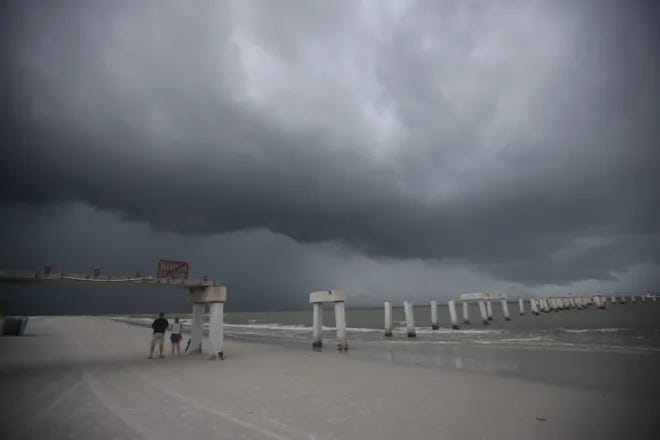
<iframe width="1280" height="720" src="title="Powerful Storm Surge From Hurricane Ian Sweeps Away Homes" frameborder="0" allow=" accelerometer; autoplay; clipboard-write; encrypted-media; gyroscope; picture-in-picture; web-share" referrerpolicy="strict-origin-when-cross-origin" allowfullscreen></iframe>Pier Destruction from Helene
Antarctica
Background:
The North Pole, also known as the Arctic, stores a significant amount of water in the form of sea ice, glaciers, and freshwater lakes and rivers. Here's a breakdown of the approximate amounts:
Sea Ice:
Arctic Ocean: The Arctic Ocean covers an area of about 14.05 million km² (5.42 million sq mi) and contains approximately 7,500 km³ (1,800 mi³) of sea ice.
Sea ice thickness: The average thickness of Arctic sea ice is about 2-3 meters (6-10 feet), with some areas reaching up to 5 meters (16 feet) or more.
Sea ice volume: The total volume of Arctic sea ice is estimated to be around 10,000-15,000 km³ (2,400-3,600 mi³).
Glaciers:
Greenland Ice Sheet: The Greenland Ice Sheet, which is not technically part of the North Pole, but is often associated with it, contains approximately 2.8 million km³ (670,000 mi³) of ice.
Arctic glaciers: The Arctic region, including Alaska, Canada, Russia, and Scandinavia, has numerous smaller glaciers that store an estimated 500,000-1,000,000 km³ (120,000-240,000 mi³) of ice.
Freshwater Lakes and Rivers:
Lakes: The largest lakes in the Arctic region, such as Lake Baikal, Lake Taymyr, and Lake Vostok, contain approximately 20,000-30,000 km³ (4,800-7,200 mi³) of freshwater.
Rivers: The major rivers in the Arctic region, including the Ob, Yenisei, and Mackenzie Rivers, carry significant amounts of freshwater into the Arctic Ocean, but the exact volume is difficult to quantify.
Total Water Storage:
Combining these estimates, the total amount of water stored at the North Pole, including sea ice, glaciers, and freshwater lakes and rivers, is approximately:
10,000-15,000 km³ (2,400-3,600 mi³) of sea ice
2,800,000-3,800,000 km³ (670,000-910,000 mi³) of glacier ice (including the Greenland Ice Sheet)
20,000-30,000 km³ (4,800-7,200 mi³) of freshwater in lakes and rivers
Total: approximately 3,830,000-4,830,000 km³ (920,000-1,160,000 mi³) of water
Keep in mind that these estimates vary depending on the source and methodology used, and the actual amounts may be higher or lower.
Now, to put this into perspective, the total amount of water on Earth is approximately 1.386 billion km³ (332 million mi³). The North Pole's water storage represents a tiny fraction of the Earth's total water, but it's still an important component of the global water cycle. Climate Change:
Temperature increase: The average global temperature has risen by about 1°C since the late 19th century, and the 20 warmest years on record have all occurred since 1981.
Greenhouse gases: The main cause of climate change is the increasing levels of greenhouse gases in the atmosphere, primarily carbon dioxide (CO2), methane (CH4), and nitrous oxide (N2O), which trap heat and lead to global warming.
Feedback loops: Feedback loops, such as the melting of Arctic sea ice and the release of methane from thawing permafrost, amplify the warming effect.
Consequences: Climate change is linked to more frequent and severe heatwaves, droughts, and heavy rainfall events, as well as rising sea levels, more intense hurricanes, and altered ecosystems.
Sea Level Rise:
Current rate: The global sea level has risen by about 15-20 cm since 1900, with an accelerating rate of about 3.2 mm per year over the past decade.
Causes: Sea level rise is primarily caused by the melting of glaciers and glaciers, as well as the thermal expansion of seawater as it warms.
Projections: The Intergovernmental Panel on Climate Change (IPCC) projects a sea level rise of 26 cm to 82 cm by 2050 and 43 cm to 110 cm by 2100, depending on the level of greenhouse gas emissions and ice sheet instability.
Ice sheet collapse: The West Antarctic Ice Sheet and the Greenland Ice Sheet are considered vulnerable to collapse, which could lead to a sea level rise of up to 3 meters or more in the long term.
Long-term Projections:
Business-as-usual scenario: If greenhouse gas emissions continue to rise, the global temperature is likely to increase by 3.2°C to 5.4°C by 2100, leading to catastrophic consequences.
Sea level rise: Under a high-emissions scenario, sea levels could rise by up to 1 meter by 2100 and 2-5 meters by 2150, displacing millions of people and causing trillions of dollars in damages.
Tipping points: The West Antarctic Ice Sheet and the Greenland Ice Sheet are considered to be at risk of collapse, which could lead to abrupt and irreversible sea level rise.
Ocean acidification: The absorption of CO2 by oceans is causing acidification, which could have devastating effects on marine ecosystems and the global food chain.
Key Findings from Recent Studies:
IPCC Special Report on the Ocean and Cryosphere (2019): Highlights the critical role of the ocean and cryosphere in the Earth's climate system and the urgent need for action to mitigate climate change.
National Oceanic and Atmospheric Administration (NOAA) Sea Level Rise Technical Report (2017): Projects a sea level rise of up to 2.5 meters by 2100 and 6.5 meters by 2150 under a high-emissions scenario.
Antarctica
Antarctica, the frozen continent at the bottom of the world, is home to a massive amount of water, mostly in the form of ice. Here's a breakdown of the approximate amounts:
Ice Sheets:
Antarctic Ice Sheet: The Antarctic Ice Sheet, which covers about 98% of the continent, contains approximately 30 million km³ (7.2 million mi³) of ice. This is about 70% of the world's fresh water and 10% of the Earth's total ice.
West Antarctic Ice Sheet: The West Antarctic Ice Sheet, which is considered one of the most unstable ice sheets, contains around 2-3 million km³ (480,000-720,000 mi³) of ice.
East Antarctic Ice Sheet: The East Antarctic Ice Sheet, which is the largest single mass of ice on Earth, contains approximately 25-30 million km³ (6,000,000-7,200,000 mi³) of ice.
Glaciers:
Glacier ice: Antarctica has numerous glaciers, including the Lambert-Fisher Glacier, which is one of the largest glaciers in the world. The total amount of glacier ice in Antarctica is estimated to be around 1-2 million km³ (240,000-480,000 mi³).
Sea Ice:
Southern Ocean: The Southern Ocean surrounding Antarctica contains a significant amount of sea ice, which varies seasonally. The maximum extent of Antarctic sea ice is around 19 million km² (7.3 million sq mi), with an average thickness of 0.5-1 meter (1.6-3.3 feet).
Freshwater Lakes and Rivers:
Lake Vostok: Lake Vostok, the largest and oldest freshwater lake on Earth, is located beneath the East Antarctic Ice Sheet and contains approximately 14,000 km³ (3,360 mi³) of water.
Other lakes and rivers: There are several other lakes and rivers in Antarctica, including Lake Ellsworth, Lake Whillans, and the Onyx River, which contain a total of around 1,000-2,000 km³ (240-480 mi³) of water.
Total Water Storage:
Combining these estimates, the total amount of water stored in Antarctica is approximately:
30 million km³ (7.2 million mi³) in the Antarctic Ice Sheet
2-3 million km³ (480,000-720,000 mi³) in the West Antarctic Ice Sheet
25-30 million km³ (6,000,000-7,200,000 mi³) in the East Antarctic Ice Sheet
1-2 million km³ (240,000-480,000 mi³) in glaciers
19 million km² (7.3 million sq mi) of sea ice (with an average thickness of 0.5-1 meter)
14,000 km³ (3,360 mi³) in Lake Vostok
1,000-2,000 km³ (240-480 mi³) in other lakes and rivers
Total: approximately 69-83 million km³ (16.5-20 million mi³) of water
To put this into perspective, the total amount of water on Earth is approximately 1.386 billion km³ (332 million mi³). Antarctica's water storage represents about 5-6% of the Earth's total water.
Keep in mind that these estimates vary depending on the source and methodology used, and the actual amounts may be higher or lower. The Ice Sheet Collapse Study (2020): Suggests that the West Antarctic Ice Sheet could collapse within the next 200 years, leading to a sea level rise of up to 3 meters.
These findings emphasize the urgent need for:
Reducing greenhouse gas emissions: To limit global warming and slow sea level rise.
Adaptation and resilience: To protect communities and ecosystems from the impacts of climate change.
Monitoring and research: To improve our understanding of the complex interactions between the climate system, oceans, and cryosphere.
For doubters, science has added facts to the predictions.
Recent scientific methods for measuring sea level rise include:
1. **Satellite Altimetry**: This technique involves satellites equipped with radar altimeters that measure the distance between the satellite and the sea surface. It provides global measurements with high precision and can detect changes in sea level over time.
2. **Tide Gauges**: Traditional tide gauges measure the height of the sea surface relative to a fixed point on land. They provide long-term data, essential for understanding local sea level changes and trends.
3. **GPS Stations**: Global Positioning System (GPS) technology is used to measure vertical land motion. By understanding how land is rising or sinking, scientists can better interpret sea level changes.
4. **Gravimetry**: Techniques like Gravity Recovery and Climate Experiment (GRACE) satellites measure variations in Earth's gravity field, helping to estimate changes in water mass and ice sheet contributions to sea level rise.
5. **Ocean Buoys**: These floating devices measure sea surface temperature, salinity, and other parameters. They provide localized data that can be useful for understanding sea level changes in specific regions.
6. **Laser Scanning and LiDAR**: These technologies create high-resolution topographic maps of coastal areas, helping to assess land elevation and its effect on local sea levels.
7. **Climate Models**: Advanced computer models simulate sea level rise scenarios based on various climate change factors, helping to predict future changes.
These methods, often used in combination, provide a comprehensive understanding of sea level rise and its implications. Remember, the window for action is rapidly closing, and the consequences of inaction will be severe.
Massive population relocation, decreased property values, increased government debt, and disaster relief. Flood mitigation such as hurricane walls, elevating homes and businesses to offset sea level rise.
Think about it…